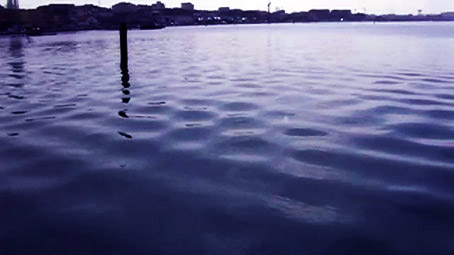
The tide is a moving result.
Whether the tide is rising or falling is always only a moving result, between the volume of molecules in the cumulative phase and those in the dissipative phase.
This is true, but I hadn't yet fully understood to what extent this is true.
It was time to go see what really happens.
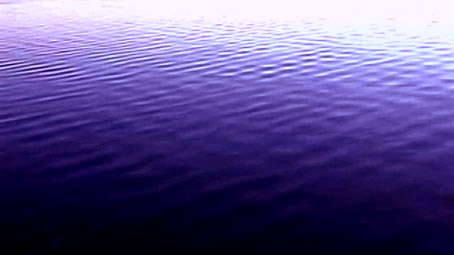
I understood this after I decided to go see how the tidal phenomenon develops, and after managing to document with videos the phenomena, which I later called "water figures" and "density waves."
It is when, under certain conditions, quantities of water molecules alternate between the cumulative and dissipative phases, every one or two seconds.
You too, reader, after watching the recordings, will understand in what sense the level of a tide is a moving result, between the cumulative and dissipative phases.
-- 2.3.#9 ---
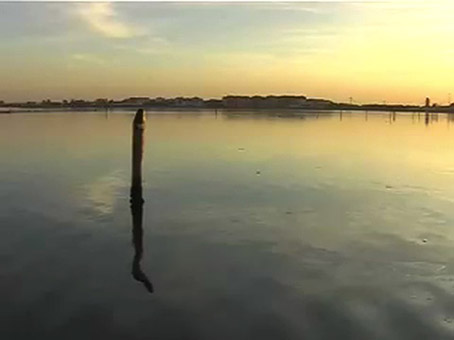
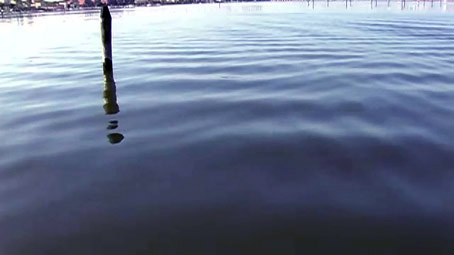
A special lagoon.
To understand how the tides work, I chose the Lusenzo Lagoon, south of the Unione Island, located between Chioggia and Sottomarina, not far from Venice.


I chose this observation point because it's the most convenient to get to from my house, but also quiet, with limited boat traffic, and has disabled parking.
Fortunately, it's also a special place for my purpose: a kind of astronomical observatory for studying the formation of the tides.